Selecting graph types to display
![]() There are 5 different graph types available to display within the application:
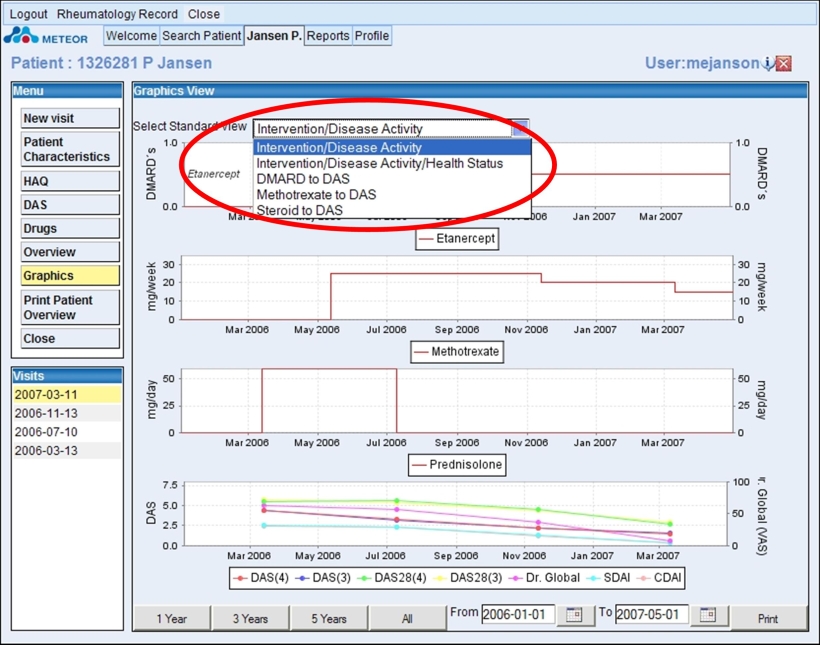
There are 5 different graph types available to display within the application:
Drop down menu reference |
Graph Information |
Intervention/Disease Activity |
This is the default view - 4 graphs are displayed: |
Intervention/Disease Activity/Health Status |
DMARD vs Time |
DMARD to DAS |
DMARD vs Time |
Methotrexate to DAS |
Methotrexate vs time |
Steroid to DAS |
Steroid vs Time |
![]() The graphs to display are selected from the drop down menu, as shown in the diagram below:
The graphs to display are selected from the drop down menu, as shown in the diagram below:
![]() The DAS graph displayed can be personalised, as explained in profile set up.
The DAS graph displayed can be personalised, as explained in profile set up.
![]() The DAS28 graph has coloured boundaries to show the high, moderate, low and remission cut offs and is the recommended view.
The DAS28 graph has coloured boundaries to show the high, moderate, low and remission cut offs and is the recommended view.
![]() The Dr Global measurement is always visible and cannot be removed from the graphs display.
The Dr Global measurement is always visible and cannot be removed from the graphs display.
![]()
© 2007 The METEOR Foundation, all rights reserved